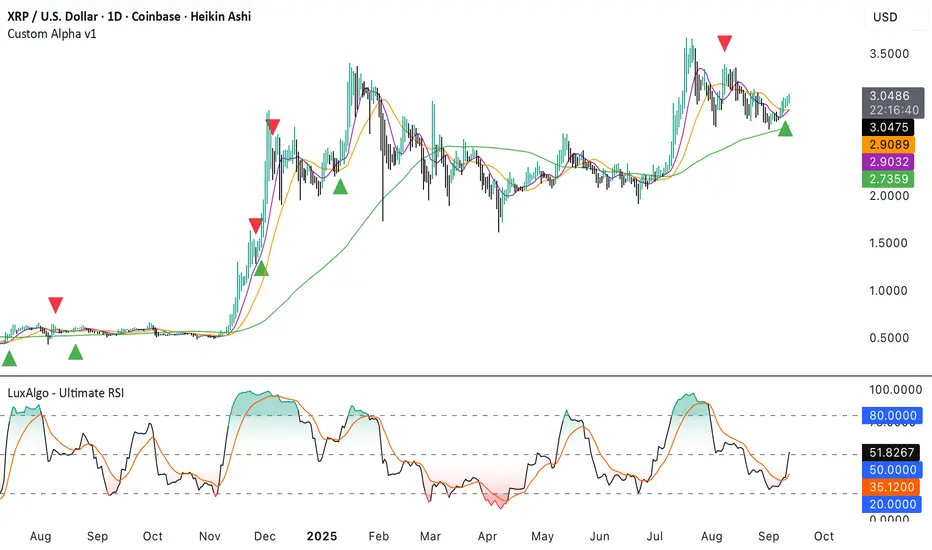
Custom Alpha v1Heiken Ashi based indicator using moving average crossovers combined with LuxAlgo Ultimate RSI with custom weighting to trigger buy and sell signals.
Settings for weightings and signal threshold are fully customizable in the indicator settings.
SMAs can be toggled on/off under the style tab of indicator settings.
ค้นหาในสคริปต์สำหรับ "moving average crossover"
Alpha v1Heiken Ashi based indicator using moving average crossovers combined with LuxAlgo Ultimate RSI with custom weighting to trigger buy and sell signals. SMAs can be toggled under the style tab of indicator settings.
For 30m time frame SMAs:
First Period = 9
Second Period = 21
Third Period = 100
All other time frame SMAs:
First Period = 21
Second Period = 50
Third Period = 200

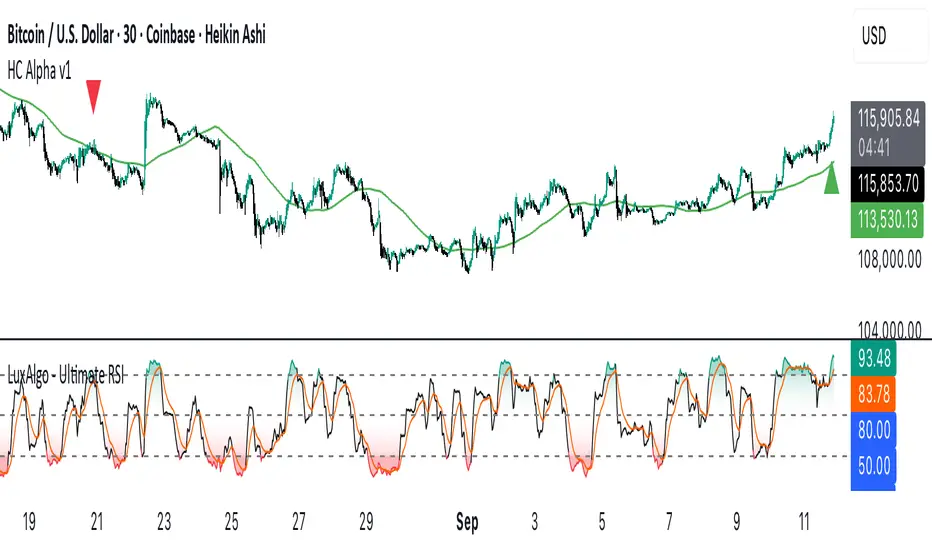
HC Alpha v1Heiken Ashi based indicator using moving average crossovers combined with LuxAlgo Ultimate RSI with custom weighting to trigger buy and sell signals. Best used on 30m / 6h time frames. Signals on 30m chart require same trend on 6h. 3d signals is another option but not as consistent. 3d is useful to look for entries on 6h chart.
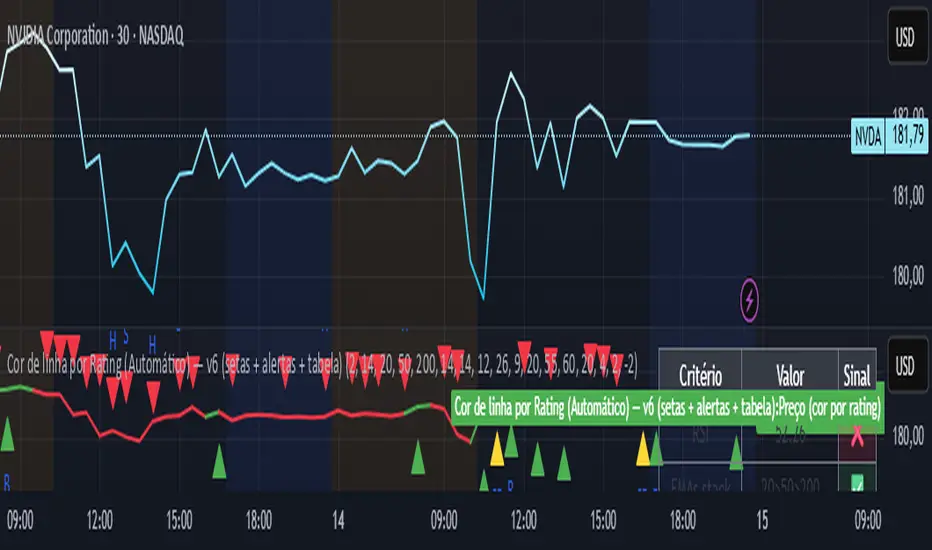
Line color best indices grouped by Artificial Intelligence
The script uses the best buy indicators, such as moving average crossovers, RSI, and others selected by AI. The idea is to determine whether the stock is classified as a strong buy (yellow line), a buy (green line), or a red (sell)
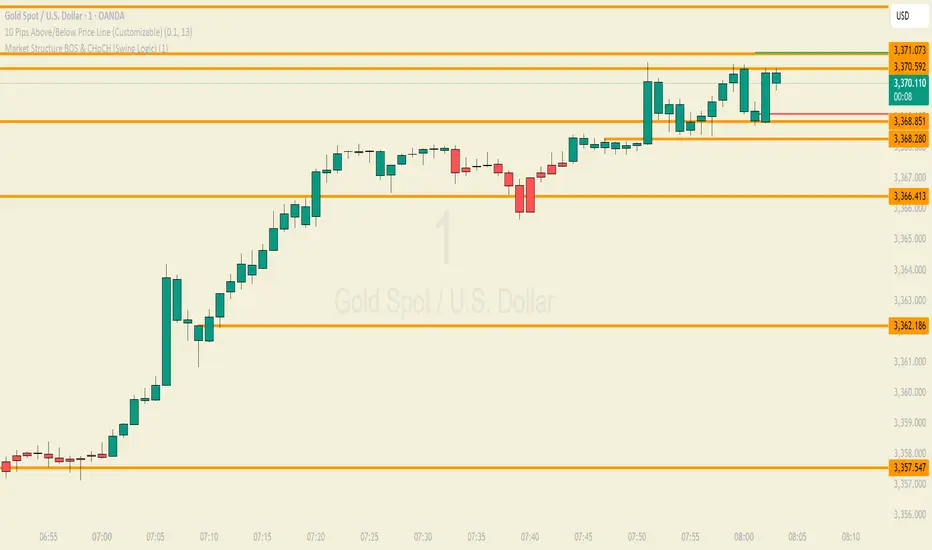
Easy Market Structure BOS & CHoCH (Swing Logic)A trend reversal occurs when the direction of the market changes from an uptrend to a downtrend or vice versa. It is typically confirmed by a shift in price structure, such as a break of key support or resistance, a change in swing highs/lows, or specific candlestick patterns like engulfing or pin bars. Indicators like RSI divergence or moving average crossovers can also support reversal identification. Reversals often follow a strong trend and signal a potential new direction in price movement

easy Market Structure BOS & CHoCH (Swing Logic)
A trend reversal occurs when the direction of the market changes from an uptrend to a downtrend or vice versa. It is typically confirmed by a shift in price structure, such as a break of key support or resistance, a change in swing highs/lows, or specific candlestick patterns like engulfing or pin bars. Indicators like RSI divergence or moving average crossovers can also support reversal identification. Reversals often follow a strong trend and signal a potential new direction in price movement
easy market structure finderA trend reversal occurs when the direction of the market changes from an uptrend to a downtrend or vice versa. It is typically confirmed by a shift in price structure, such as a break of key support or resistance, a change in swing highs/lows, or specific candlestick patterns like engulfing or pin bars. Indicators like RSI divergence or moving average crossovers can also support reversal identification. Reversals often follow a strong trend and signal a potential new direction in price movement

Stop Loss & Take Profit For Overlay Indicators[LePasha] Stop Loss & Take Profit For Overlay Indicators
This indicator helps traders easily visualize Stop Loss (SL) and Take Profit (TP) levels based on custom buy and sell signals from any overlay indicators or price-based sources.
Key Features:
Accepts buy and sell signals from any indicator or price source on your chart.
Automatically calculates SL and TP levels using ATR-based volatility for dynamic risk management.
Allows customization of capital, risk percentage per trade, and reward-to-risk ratio.
Displays clear colored boxes on the chart showing potential profit and loss zones.
Calculates position size and required leverage based on your risk settings.
Designed to work with your preferred strategies by simply connecting signal inputs.
Helps you visually manage trades with precise risk control and reward targets.
How to Use:
Connect your buy and sell signals (e.g., from Moving Average crossovers, custom scripts, or price levels) to the indicator’s inputs.
Adjust risk settings to fit your trading style (capital, risk %, reward ratio).
Watch as the indicator draws TP and SL zones on your chart when signals occur.
Use this information to set stops and targets in your trades confidently.
Perfect for traders who want simple, clear, and reliable trade management visuals based on their own strategy signals.

InspireHER Dynamic EMA RR Positioning IndicatorDynamic EMA and RR Positioning Indicator
This indicator is designed to provide traders with highly customizable buy and sell signals based on EMA (Exponential Moving Average) crossovers and Risk-to-Reward (RR) ratios. It works on any timeframe and allows users to toggle price data and additional position boxes for visualizing trade setups. Additionally, traders can choose between displaying dots or labeled signals for buy/sell indicators, making this tool versatile and user-friendly for different preferences and strategies.
What Makes This Indicator Unique
Customizable Parameters: The script offers extensive options for tailoring the indicator to your preferred trading style and strategy:
EMA: Configurable through settings (default is a 21-period EMA).
Risk-to-Reward Ratio (RR): Adjustable to meet your desired RR levels (default is 1:2.5).
Lookback Period: Visualizes buy/sell signals over the last six months.
Position Boxes for Trade Visualization: The indicator can "draw" position boxes on the chart, showing potential entry points, stop-loss (SL), and take-profit (TP) levels based on the selected RR. These visual aids simplify decision-making and help evaluate trade opportunities directly on the chart.
Price Data Toggle: Traders can choose to view or hide price data related to trade signals, including TP, SL, and RR values. By default, this is turned off to maintain a clean chart but can be activated when needed.
Flexible Signal Display Options:
Dots Mode: Displays buy signals as green dots and sell signals as red dots on the chart.
Label Mode: Displays buy signals as labels with the word "Buy" in green and sell signals as labels with the word "Sell" in red.
This toggle allows traders to customize how signals are displayed for a more personalized trading experience.
Simple Signal View: A toggle option provides a cleaner chart by enabling or disabling additional visual elements like circles or labels.
How It Works
Buy Signal: Triggered when the price crosses the EMA and closes above it.
Entry: Top of the candle.
Stop-Loss: Bottom of the candle.
Take-Profit: Calculated based on the selected RR.
Sell Signal: Triggered when the price crosses the EMA and closes below it.
Entry: Bottom of the candle.
Stop-Loss: Top of the candle.
Take-Profit: Calculated based on the selected RR.
Default Settings
EMA: 21-period.
Risk-to-Reward Ratio: 1:2.5.
Price Data: Off (can be toggled on in settings).
Position Boxes: Off (can be toggled on in settings).
Signal Display: Labels mode with "Buy" (green) and "Sell" (red) enabled by default; can be toggled to Dots mode.
Timeframe: Any timeframe supported.
How to Use
Add the Indicator to Your Chart: Once applied, the EMA line and buy/sell signals will appear by default.
Customize Settings: Navigate to the indicator's settings to adjust EMA, RR, or enable/disable Price Data, Position Boxes, or switch between Dots and Label modes.
Trade with Confidence: Use the visual aids and signals to assess trade opportunities based on your strategy and timeframe.
This indicator combines the reliability of EMA-based signals with the flexibility of configurable RR, visual trade setups, and multiple signal display options, making it a powerful tool for all types of traders. Happy Trading!!

Indian Market Sessions for BacktestingThis indicator is designed to increase the quality of your backtesting in the Indian Market.
NSE & BSE run from 9:15 am IST to 3:30 pm IST.
Naturally different times have different kinds of volatility.
On your chart you will find premarked -
Saffron - 9:15 am to 10:30 am - Opening Session - High Volatility Observed Historically
White - 10:35 am to 2:25 pm - Middle Session - Lower Volatility Observed Historically
Green - 2:30 pm to 3:30 pm - Closing Session - Medium to High Volatility Observed Historically
You will also find the start of each session marked with an arrow.
Feel free to change the times from the input settings and the color and visibility from the style settings.
_______________
Usage:
When you backtest any strategies, say moving average crossovers, also mark the sessions in your sheet which will help you further increase accuracy.
Feel free to drop your doubts in the comments.

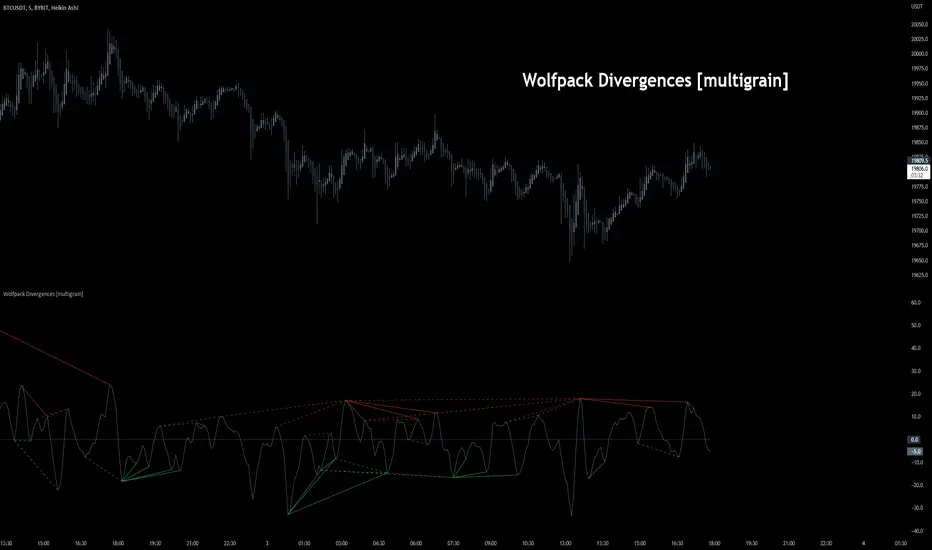
Wolfpack Divergences [multigrain]█ OVERVIEW
A fast and improved divergence finding algorithm that aims to be better than the built-in TradingView divergence algorithm.
█ CONCEPTS
Wolfpack
Wolfpack is an oscillator made popular by darrellfischer1 all the way back in 2017. Since then the Wolfpack oscillator has been utilized by a number of notable strategy/indicator creators. At some point it was realized that the oscillator was simply the Moving Average Crossover Divergence oscillator with the fast and slow length of 3 and 8, respectively. The true significance and reasoning behind these lengths are unknown, however one may surmise that they are chosen due to their relevance as Fibonacci numbers.
Divergences
Divergence is when the price of an asset is moving in the opposite direction of a technical indicator, such as an oscillator, or is moving contrary to other data. Divergence warns that the current price trend may be weakening, and in some cases may lead to the price changing direction.
█ USAGE
Wolfpack
Similar to many other oscillators, when the Wolfpack oscillator reports a value above the zero-line, this indicates a bullish trend in the price. Subsequently, a value below the zero-line indicate a bearish trend in the price.
Divergences
Divergence in technical analysis may signal a major positive or negative price move. A positive divergence occurs when the price of an asset makes a new low while an indicator, such as money flow, starts to climb. Conversely, a negative divergence is when the price makes a new high but the indicator being analyzed makes a lower high.
Algo Trading (Nifty & BankNifty)What is Algo Trading ( Nifty & Bank Nifty ) Indicator?
There are many 9 to 5 working professionals who have some spare money to invest each month but they can not do active trading because they are busy with their full time job.
So they wish to have an automated system which could take and close trades for them with a proven back-tested strategy, proper money management, ability to trade within particular timings, pre-defined maximum loss they can bear and so on.
This indicator facilities all such needs of working professionals.
How this indicator generates signals?
This indicator generates signals in 3 ways:
(a) Pricing action validated by Jump in Volume
(b) Moving Average Crossovers
(c) Zeta Force Signals as generated by our proprietary formula for Bank Nifty & Nifty
Once a threshold value is crossed, the Buy/Sell signal (LE & SE) appears on the chart and algo keeps track of the current state. Then this state is remembered for the loss or profit the trade is generating and position is closed either when loss crosses the set limit or when profitable trade starts receding.
What are the various features of this indicator?
(a) You can define your session timing i.e. the time period when you want your trades to be taken. For example: between 1000 hrs to 1330 hrs or so on.
(b) You can choose to close all positions by EOD . ( EOD is defined by the user. For example, if you set the session timing between 9:30 to 11:00 am, then indicator will not take any trades outside
this range).
(c) You can define the total loss you can bear during a particular day. For example, if total loss is 5% for the day, the algo stops taking further trades.
(d) You can set up either manual alerts for each event, for example Buy, Sell, Buy Close, Sell Close where you can customize the message you want to display or you can select the 'Any Alert()
function call' option which will generate pop up messages in TradeTron or Algoji friendly format. These signals can be routed to 3rd party platforms for execution. If you have TradeTron or
Algoji Account, you can enter your API key in algo settings, and after that the messages generated will contain your API Key by default.
What are the limitations of this indicator?
You can not make money with any indicator or algo if market is narrow range bound.
For you to make money, there must be a trend or mini-trend. Sometimes, price starts trending for a while and then reverses back. In such cases, multiple Stop Loss Hits might occur.
Can I use this for Option Trading also?
Deep in the money options behave like Futures only. So yes, you can use this algo for Options Trading by buying Deep in the money options.
Can I use this for trading in stocks or any other instrument?
No. The code has been hard-wired for Bank Nifty & Nifty (Indian Indices) only. A different, generic version of this algo is in the pipeline which can be used for Forex or Commodity and Stocks.

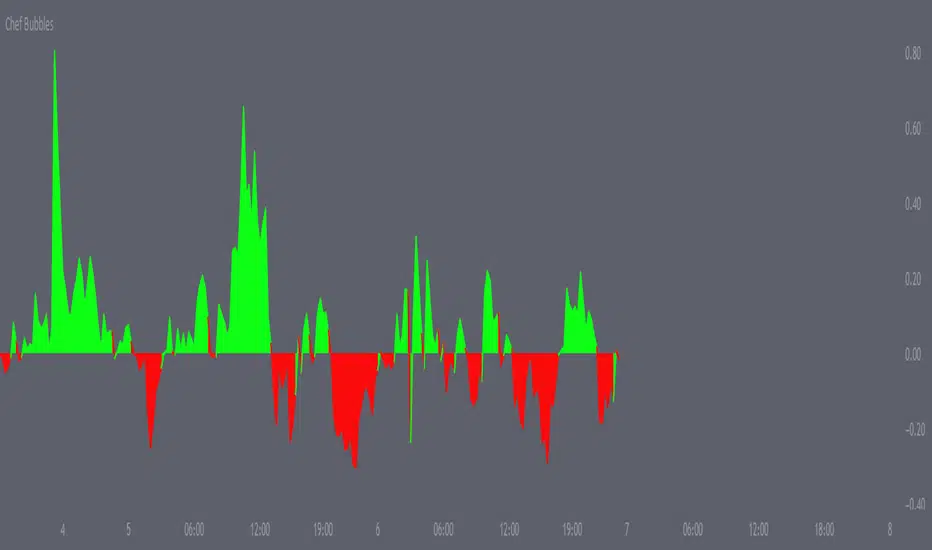
Chef BubblesThis is an enhanced version of Momentum indication Ways that shows 2 ways to calculate momentum and display each one along with their combined average value.
Essentially I've matched the momentum from the lower time frames together to determine when we are getting a push, amazing for scalps, I use it for everything.
Alongside this, I also made sure to add the currency's strength pretty much embedded within the momentum indicator , thus giving you the best momentum indication you can get a good entry point majority of the time if used right. I recommend matching this with my moving average crossover pair.
Open Close Cross Strategy R6.1 revised by yourmattieOriginal version: Open Close Cross Strategy R5 revised by JustUncle.
Change: script changed to a study script with custom alerts.
This revision is an open Public release, with just some minor changes. It is a revision of the Strategy "Open Close Cross Strategy R2" originally published by @JayRogers.
Revised by JustUncleL
Description :
Strategy based around Open-Close Moving Average Crossovers optionally from a higher time frame.
Read more about the indicator original script
Klik here
##USE AT YOUR OWN RISK##
Use this as overlayer on the original strategy to set custom alerts.
Info: with this study script no buy/sell arrows show up op the chart.
Does some know a solution for this issue:
Issue: sometimes it gives a false signal because even when you set "one per bar close" the custom set alert might come halfway the bar....and it might be a false signal when the bar is closed
Does somone know a fix for this? I tried with barstate.iscomfirmed but it didn't work for me.
Ps. I'm not a developer...just changed the scipt by watching a youtube tutorial.
FS_TrendCrossThis indicator is trendfollowing and is based on moving average crossovers with support of ichimoku cloud .
It gives buy and sell signals when certain conditions based on EMAs are met.
This indicator can be used in any trending markets.

PpSignal The Ultimate Moving Average Crossover 3.0 (CFB)CFB tells you how long the market has been in a quality trend. This value can be used to adjust the period length of other indicators, especially stochastic bands.In order to quantify the overall duration of a market's trend, we replaced classical cycle analysis methods (FFT, MEM, MESA) with a form of analysis that works even when no cycles exist. We accomplished this by examining a time series for specific fractal patterns of any size. We then gather all the patterns found and combine them into one overall index, CFB (Composite Fractal Behavior) Index.For good reason, CFB does not analyze time series data for dominant cycles. Classical cycle analysis examines data points (e.g. prices) and estimates the average presence of a cycle in the window. Now suppose a cycle with a period length of 9 days was strong for 50 days and then disappeared for the next 21 days

BullTrading Intraday StopHunt Indicator Phycologically traders tend to sell on lows and buy on highs. BullTrading Intraday StopHunt Indicator is designed to help you avoid such situations by monitoring the market for intraday trading setups.
The indicator plots a "Fractal Envelope © " containing the most significant Support and Resistance levels for analysis and entry level selection.
Trend filtering is provided by a MTF P-SAR (SAR will avoid repainting false signals).
The BullTrading Chaos Trend Wave is used instead the Alligator to trade fractals.
BullTrading Intraday StopHunt Indicator will provide 3 types of signals:
First one is a swing/intraday signal, it will alert you when the price is located at a very sensitive level (buy or sell) filtered by trend. If you check the indicator after the close of the day you can even know this exact level in advance (plot Red or Lime color).
Second signal will alert you the Chaos Trend Wave Moving Average Crossovers filtered by price position (related to the Fractal Envelope) and mayor trend.
Third signal is a scalping signal, it will alert you all the fractal breakouts filtered by price position (related to the Fractal Envelope) and mayor trend.
You will be amazed the huge amount of trade opportunities for a given week trading only one financial instrument.
Obviously the indicator is not perfect and will plot few false signals on mayor trend reversals or big price manipulations. AVOID THE TRAP BY WAITING THE PRICE USING BUY LIMIT AND SELL LIMIT ORDERS.
NOTE: This indicator works on any timeframe, but standard settings are calibrated for 15' charts.

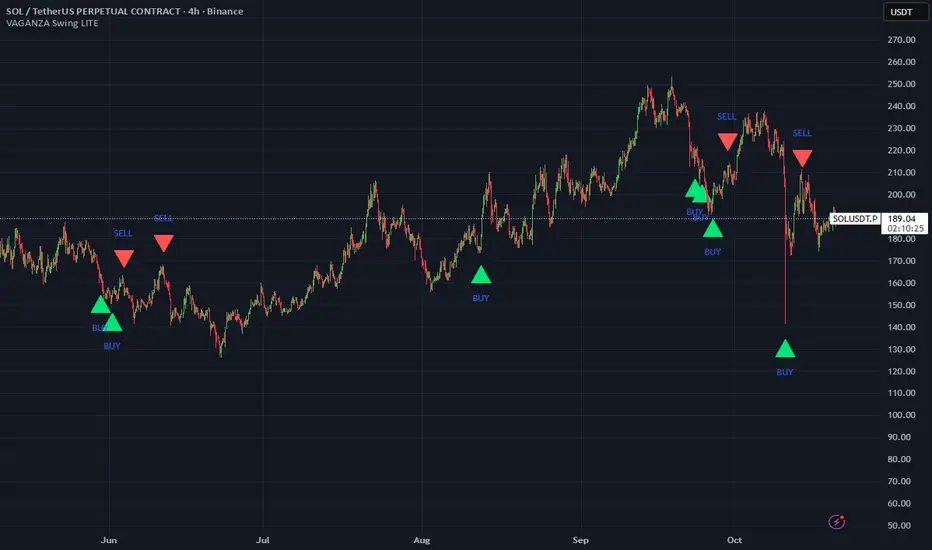
VAGANZA Swings V1 LITE1. Introduction: The Philosophy Behind VAGANZA Swings
The VAGANZA Swings V1 LITE was developed to solve a common problem faced by swing traders: getting caught in low-probability trades during choppy, sideways markets. Many indicators can identify a trend, but few can effectively measure its quality and pinpoint optimal, low-risk entry points within that trend.
This script is not merely a "mashup" of existing indicators. It is a structured, multi-layered filtering system where each component is specifically chosen to address the weaknesses of the others. The core philosophy is to trade only when there is a clear market consensus, confirmed by trend, strength, momentum, and volume. This results in fewer signals, but each signal is designed to be of significantly higher quality.
2. The VAGANZA Confirmation Engine: A Deeper Look at the Logic
A signal is only generated when four distinct market conditions align. This sequential confirmation process is what makes the script unique and robust.
Layer 1: The Trend Regime Filter
What it does: The indicator first establishes the dominant market bias using a dual-speed baseline system. A faster-reacting baseline is compared against a slower, more stable baseline to determine if the market is in a long-term bullish or bearish "regime."
Why it's important: This foundational step ensures we are never fighting the primary market current. BUY signals are disabled during a bearish regime, and SELL signals are disabled during a bullish regime, instantly eliminating 50% of potentially bad trades.
Layer 2: The Trend Strength & Conviction Qualifier
What it does: This is the script's core intelligence. After confirming the trend's direction, this layer uses a directional volatility engine to measure the trend's strength or conviction. It analyzes the expansion between bullish and bearish price movements.
Why it's important: A simple moving average crossover can occur in a weak, drifting market, leading to false signals. This filter requires the trend to be demonstrably powerful (above a predefined strength threshold of 25) before allowing the system to even look for an entry. It's the primary filter for avoiding sideways market traps.
Layer 3: The Dynamic Pullback & Entry Trigger
What it does: Instead of chasing price at its peak, the script waits for a natural "breather" or pullback. It employs a momentum cycle oscillator to identify when the price has become temporarily oversold within a strong uptrend, or overbought within a strong downtrend. The signal is triggered at the precise moment momentum appears to be rejoining the primary trend.
Why it's important: This ensures a more favorable risk-to-reward ratio. By entering on a pullback, traders can avoid buying the top or selling the bottom of a short-term swing, which is a common mistake.
Layer 4: The Volume Participation Check
What it does: As a final confirmation, the script checks the volume on the signal candle. It requires the volume to be higher than its recent average.
Why it's important: A price move without significant volume can be a trap. This final check confirms that there is genuine market participation and conviction behind the signal, suggesting that larger market players are supporting the move.
3. The Synergy of the System (Why This Combination is Original)
The originality of VAGANZA Swings lies not in its individual components, but in their synergistic interaction:
The Trend Regime Filter sets the stage.
The Trend Strength Qualifier prevents signals when the stage is poorly lit (i.e., a weak trend).
The Pullback & Entry Trigger tells the actor exactly when to enter the stage for maximum impact.
The Volume Check ensures the audience is actually watching.
Without the strength filter, the trend filter would fail in ranging markets. Without the pullback trigger, entries would have poor risk-reward. This interdependent, sequential logic provides a unique and useful tool that goes beyond what a single indicator can offer.
4. How to Use This Script
Timeframe: Optimized for the 4-Hour (H4) chart, as this provides a balance between meaningful swings and actionable signals. It can also be used on the Daily (D1) chart for longer-term analysis.
BUY Signal (Green "BUY" Arrow): Appears only when a strong, confirmed uptrend experiences a temporary, oversold pullback and volume confirms renewed buying interest. This is a high-probability signal to consider a long position.
SELL Signal (Red "SELL" Arrow): Appears only when a strong, confirmed downtrend experiences a temporary, overbought rally and volume confirms renewed selling pressure. This is a high-probability signal to consider a short position.
Risk Management: This indicator provides entry signals only. It is crucial that you apply your own risk management rules. Always use a stop-loss and have a clear take-profit strategy for every trade.
Disclaimer: This tool is for decision-support and does not constitute financial advice. All trading involves risk. Past performance is not indicative of future results. Please backtest thoroughly before using this script with real capital.
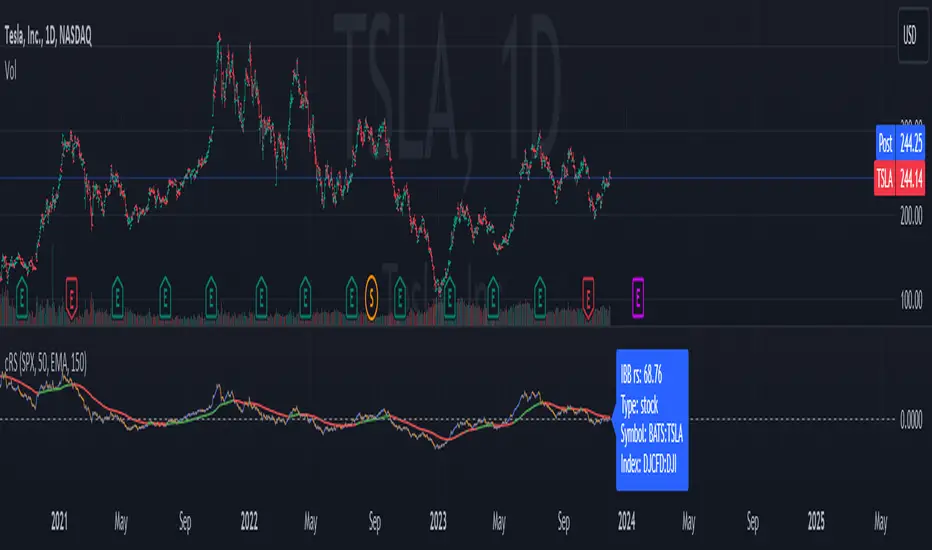
Comparative Relative Strength AutoselectComparative Relative Strength (CRS) is a relative momentum indicator, used to compare a security against an index, or against another security. The comparison is used to show the relative performance to each other.
This script is a Quality of Life improvement, which attempts to match the base symbol to its relevant index on the local stock exchange. Thus automagically selecting the best and most relevant comparative symbol.
Features:
*optional comparative symbol override, in case your favourite index is not included in this script, or you want to force it to function as as a traditional cRS script without the autoselect feature.
* optional moving average crossover line
* optional absolute momentum calculation, calculating the excess return of the basesymbol and comparativesymbol against its own simple moving average.
PpSignal The Ultimate Moving Average Crossover 2.0In this version we move out hauken ashi smoothed, bollinguer band and coral. in this version the script have Vidya MA yelloy red color, step ma, lime maroon color, VMA gren. solver and red color and ppsignal hilo trima ma, with different time frame.
If you work in time frame 5 min to 15 min we recommend use hilo trima or alma in 60 min time frame, if you use 30 min to 60 min en 240 min time frame, and d in weekly time frame.

SMACPAC SignalsSimple Moving Average Crossover Price Action Confirmation Strategy
Simply marks key signals or strength and weakness in the chart.
Alerts set up on t.me for SOL/USDT and PEPE/USDT daily charts and more

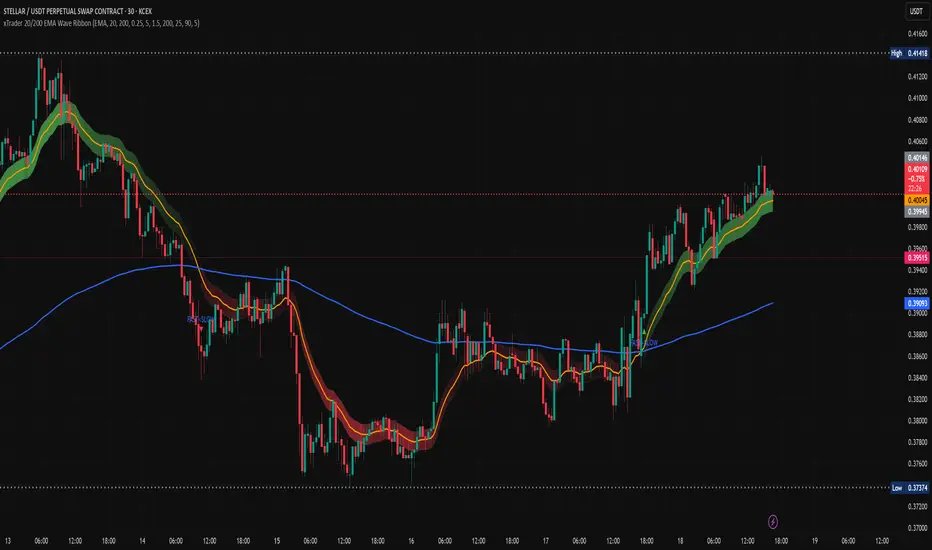
xTrader 20/200 EMA Wave Ribbon🔹 20/200 EMA Wave Ribbon
This indicator expands on the classic 20/200 moving average crossover by turning it into a momentum-aware ribbon. Instead of only showing where two lines cross, it highlights trend bias and momentum strength together in a visual form that adapts across timeframes.
🔑 How It Works
Fast / Slow MAs: Calculates a fast MA (default 20) and a slow MA (default 200). Traders can choose the MA type (EMA, SMA, WMA, RMA).
Bias: When the fast MA is above the slow MA, the ribbon turns 🟢 green (bullish). When it is below, the ribbon turns 🔴 red (bearish).
Wave Ribbon: A band is plotted around the fast MA. Its width comes from a user-defined percent of price, optionally scaled by ATR volatility so the ribbon stays meaningful on both 5m and 1D charts.
MACD-style intensity: Ribbon color adjusts with the separation between fast and slow MAs. Strong expansion makes the ribbon brighter and thicker; contraction makes it softer and thinner. This gives the same “growing and fading” feel traders know from MACD histograms.
Noise Control: Persistence settings can require several bars of agreement before a bias flip is confirmed, reducing whipsaws.
Signals: Optional markers and alerts trigger on bullish and bearish crosses.
📈 Practical Use
Bright, widening ribbon → trend is accelerating; continuation bias is strong.
Dimming ribbon → momentum is weakening; consider scaling out or tightening risk.
Color flip → regime change; possible entry/exit depending on confirmation settings.
Timeframe scaling → ensures ribbon width adapts to volatility, so interpretation is consistent across intraday and higher-timeframe charts.
⚡ What Makes It Different
Unlike open-source EMA cross scripts that only mark crosses:
✅ Plots a dynamic ribbon around the fast MA instead of shading the whole chart.
✅ Uses ATR-based auto-scaling to stay useful on all timeframes.
✅ Applies MACD-style intensity mapping to show not just bias, but trend strength and momentum shifts.
✅ Includes MA type selection (EMA, SMA, WMA, RMA) and persistence logic for confirmation.
⚠️ Disclaimer: This script is for educational and analytical purposes only. It is not financial advice. Always do your own research and use proper risk management before trading.